Cities Speak: What We Learn When Language Meets Data
What New York’s Urban Textscape teaches about language, space, and time—and how to think with it inside organizations.
A brief opening
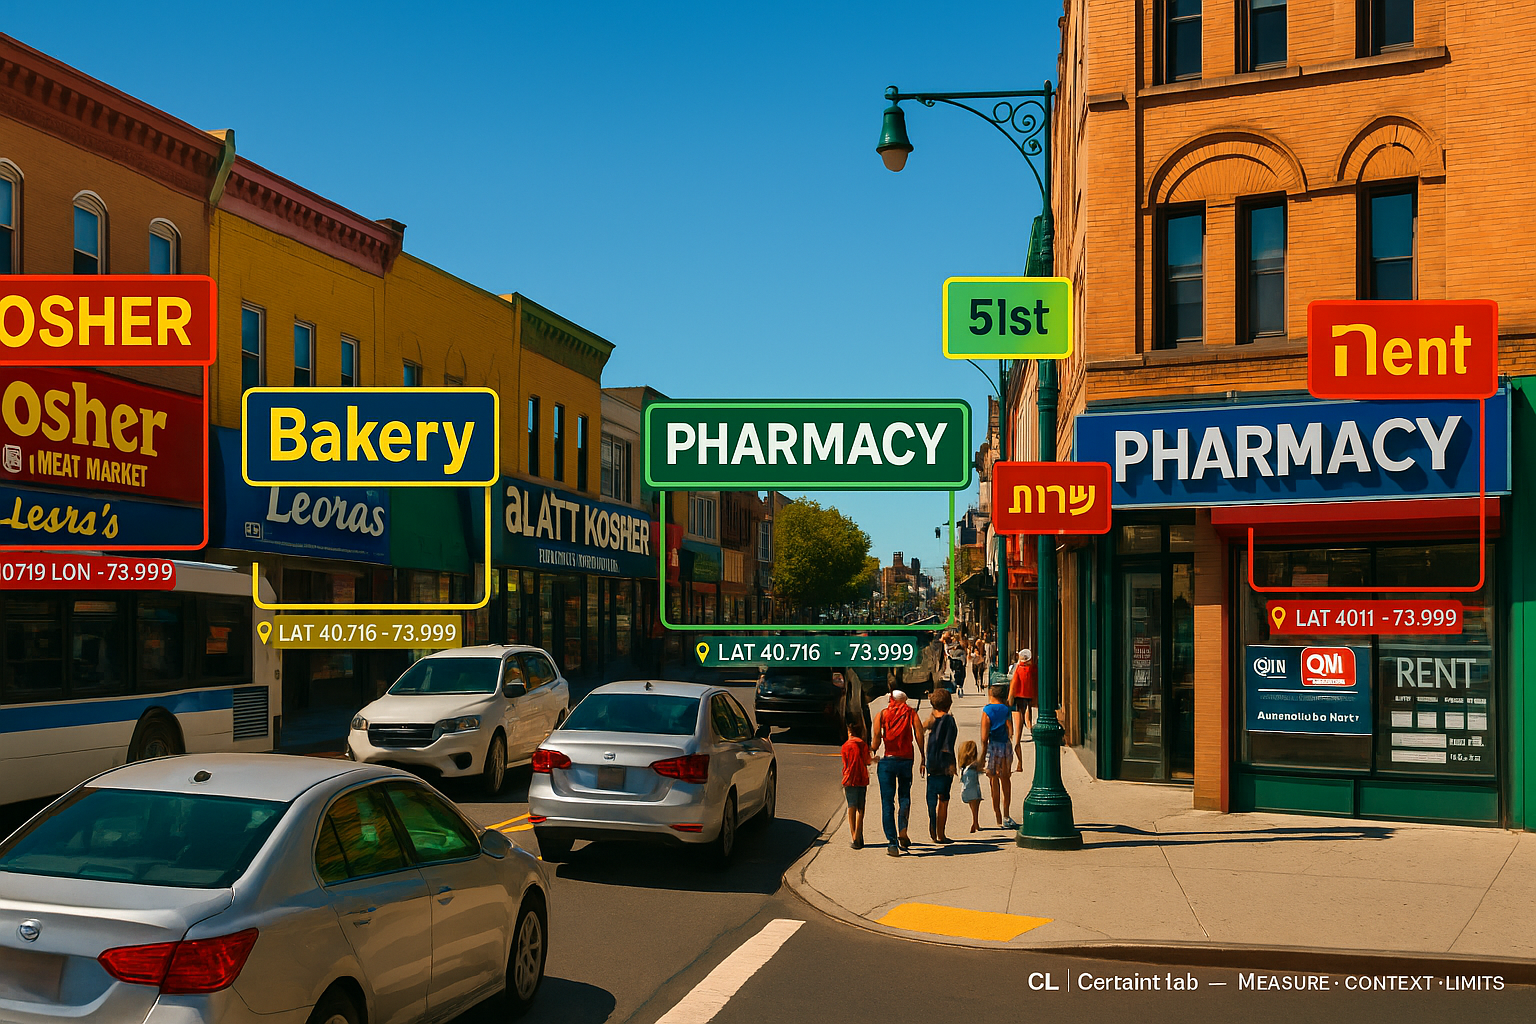
Imagine a map that doesn’t draw roads or borders, but words. “Pizza,” “Repair,” “Pharmacy,” “Rent”—texts appearing on storefront signs, stickers, graffiti, and notices. New York’s Urban Textscape turns the Google Street View archive into a search engine for words in the street: millions of images, tens of millions of text snippets, and an interactive map that reveals how the city’s language spreads across space and changes over time.
Why it matters
Language as an urban texture: Words aren’t scattered randomly; they trace neighborhoods, commercial corridors, and cultural hubs.
Time as a lens: A multi-year archive allows us to see the emergence and decline of brands, seasons, trends, and local economies.
Tangible multilingualism: A map that shows where different languages surface—an accessible lens on communities and identities.
How it works
Collection: Street-level imagery from recent years (including historical versions), indexed by place and date.
Text extraction (OCR): Computer-vision models detect text regions and transcribe them into words.
Mapping and search: Each word is anchored to coordinates; users filter by keywords, categories, and time.
Visualization: Map layers make patterns legible at a glance—densities, brand “islands,” multilingual pockets.
What we learn from it
- Food geographies: Where “Bakery” or “Slice” cluster—and what that implies about consumption habits.
- Brand fingerprints: The spatial “spheres of influence” of specific chains along commercial axes.
- Urban vitality: Signals of commercial activity (new/old signage, the turnover rate of words). Limitations and considerations
- Partial coverage: The camera car doesn’t capture everything; alleys and restricted areas may be absent.
- Perceptual bias: Small/occluded/low-light text is under-detected; cross-neighborhood comparisons require normalization.
- Seasonality and timing: Different capture dates introduce noise that must be addressed.
- Script disparities: OCR typically performs better on Latin scripts than on others—teams should account for this.
- Bottom line: this is a map of words as the camera sees them, not necessarily as the city “experiences” them. It provides intelligent indications—not definitive proof.
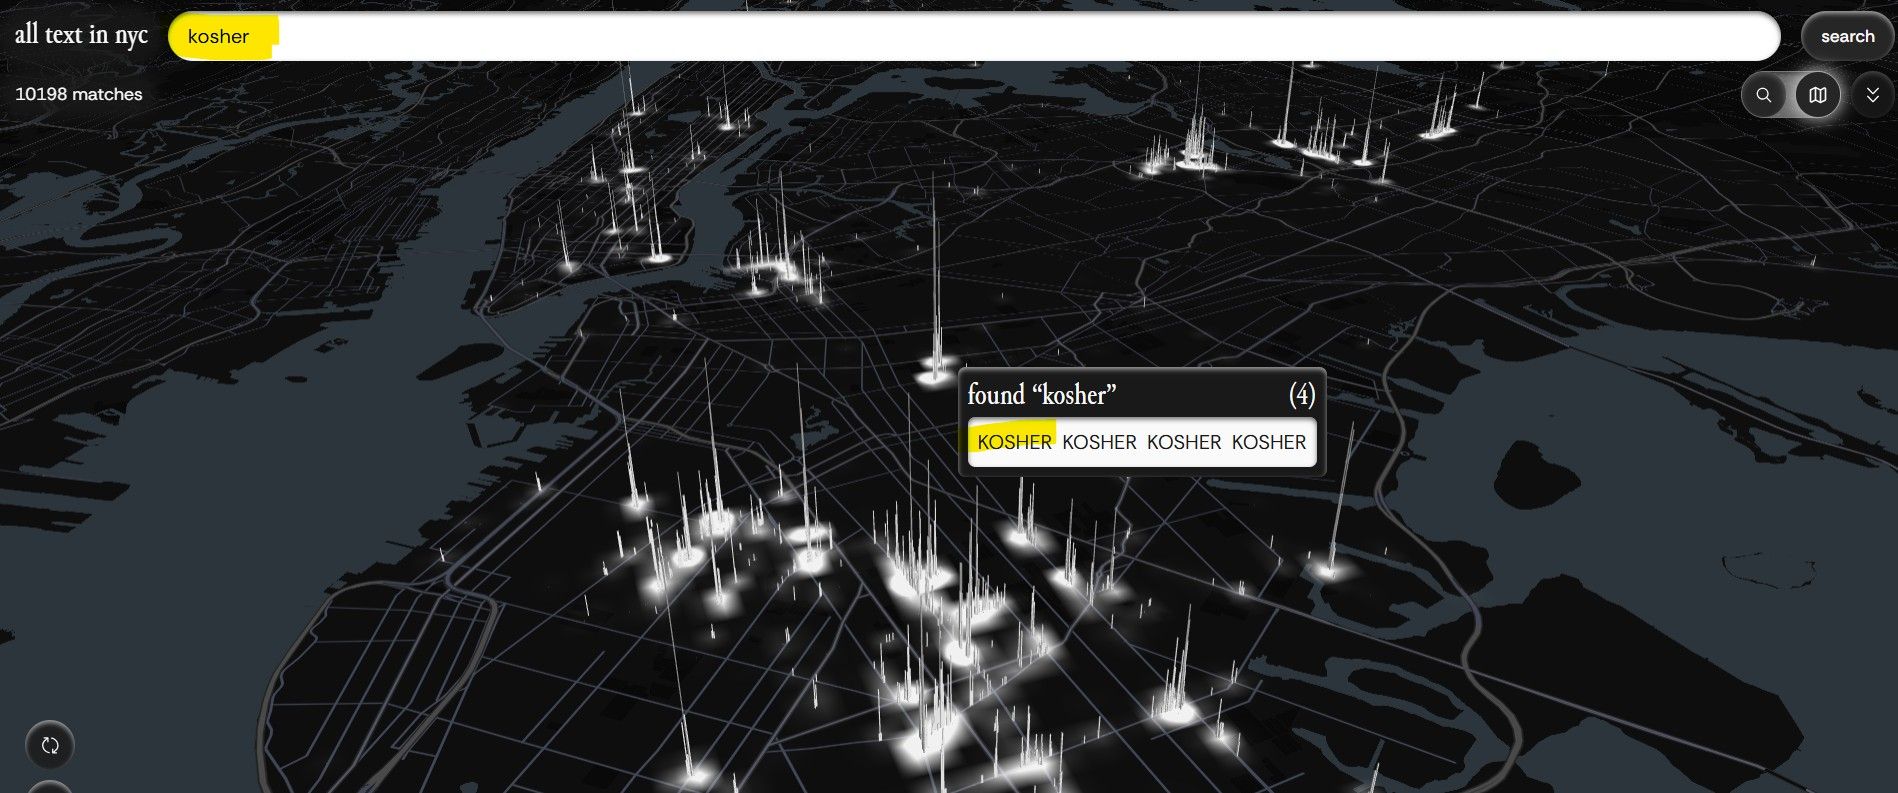
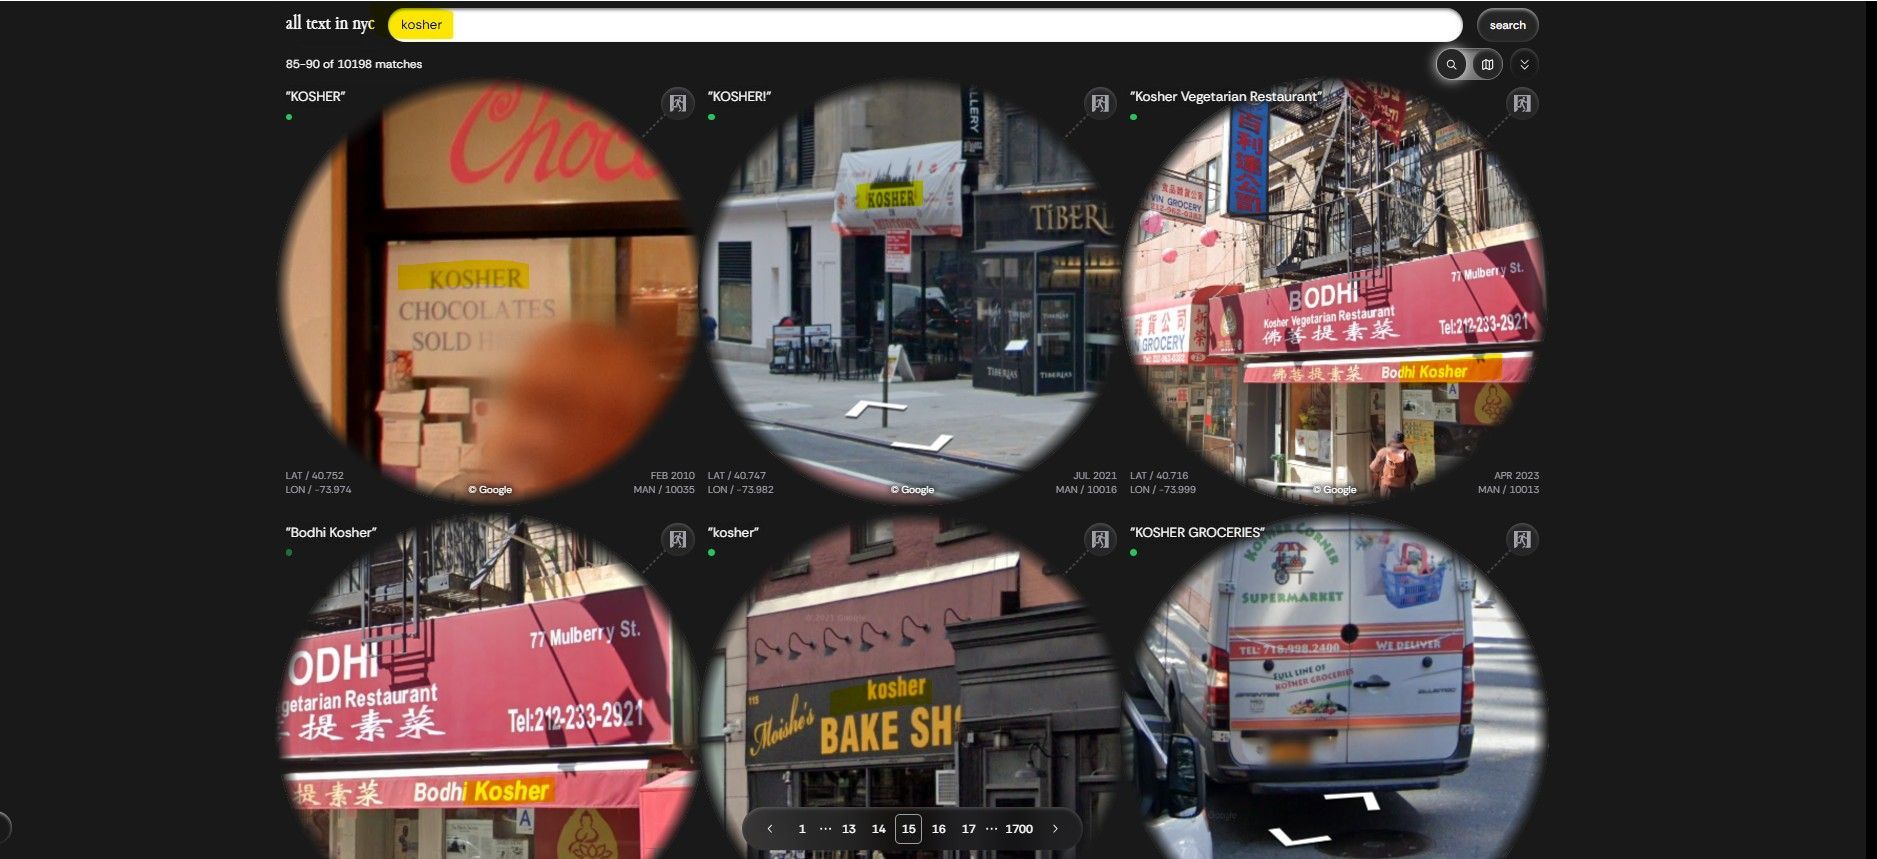
Demonstration: searching “KOSHER” — What shows up, and how to use it
I queried
KOSHER and received over 100,000 matches distributed across all five boroughs.
The interface exposes two complementary views:
- Dynamic density map (3D spikes): highlights clusters, with zoom by borough/neighborhood and a time slider.
- Photo gallery: every occurrence as captured in Street View, with date and coordinates—one click opens the local context and lets you scan image by image.
What you can infer
- Spatial concentrations: matches coalesce around recognizable commercial and community corridors—an indicator of a live cultural–economic landscape.
- Temporal dynamics: appearances wax and wane over the years— a sensitive proxy for demographic, commercial, or regulatory change.
- Linguistic variants: “Kosher,” “Glatt Kosher,” “Kosher Groceries,” etc., allow finer-grained categorization and audience segmentation.
How to leverage it
- Scientific/analytical: compute multilingualism, density, and spatial entropy; build time series and cross-reference with GIS layers (land use, transit, pricing).
- Commercial: map demand islands for kosher food/retail; identify white spaces for new locations or OOH placements; audit brand consistency on the ground.
- Civic/policy: evaluate language accessibility (signage), monitor policy implementation, and prioritize inspections based on change patterns.
Note: The exact match count can vary with time windows, filters, case sensitivity, de-duplication, and other search settings.
Three operating principles we adopt at Certainty Lab
- Measurement before narrative: Start with data quality (coverage, consistency, timing), then craft the story.
- Context before conclusion: Fuse complementary layers (business registries/transport/land use) to support or falsify hypotheses.
- Transparent limits: Mark blind spots and biases, and embed uncertainty estimates in dashboards and reports.
How this meets our work at Certainty Lab
We treat every data repository—even one that lies dormant—like a latent gold seam. Our craft is to locate the seam, mine relevant signals, refine them into reliable insights, and activate them inside live decision systems.
- Data Prospecting: Systematically surveying existing sources—CRM, documents, images/video, field reports, service centers, web analytics—to pinpoint pockets of value that can be mobilized quickly. Output: a data map plus three immediately actionable use cases.
- Data Refinery: Cleaning, normalization, multilingual handling; OCR/Visual-NLP where needed; spatial/temporal linkage; entity resolution to turn scattered records into coherent knowledge.
- Knowledge Activation: Converting information into retrieval-augmented question-answering (RAG) and interactive dashboards. Think “Atlas of Words” in the street—translated for clients into an Atlas of Claims (social orgs), Atlas of Donors (nonprofits), Atlas of Maintenance (municipal/operational), or Atlas of Retail (commerce).
- Decision Loops: AI agents that recommend next actions, flag anomalies, and synchronize KPIs with the tools teams already use (email/chat/BI).
- Governance & Ethics: From day one—measurement limits, privacy, and risk reduction—so insights are not only sharp but responsible and durable.
Pilot → Production: Start with a focused nucleus, scale by demonstrated impact, and maintain quality through continuous QA.
In closing
Urban Textscape reminds us that cities speak—through words on walls, windows, and signs. If we listen correctly, we understand space, community, and time more clearly. The real methodology isn’t to “draw a beautiful map,” but to combine careful measurement, rich context, and transparent limits—and then transform dormant data stores into living systems that produce actionable knowledge.
Content and visual insights are informed by Urban Textscape — courtesy of The Pudding.